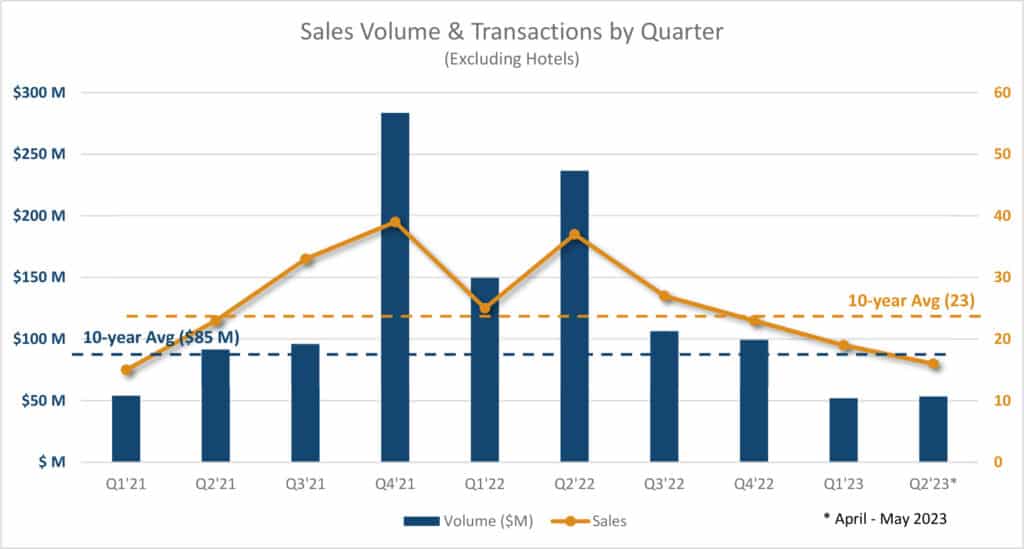
The commercial sales during April and May demonstrate that Q2 will surpass Q1 for dollar volume and, perhaps, transactions. Below is a chart showing sales volume and transactions by quarter since 2021, excluding hotel property. Note that the Q2’23 values do not yet include any June sales and will be higher by the end of the quarter. Q1 was well below the 10-year averages for dollar volume and transactions, and Q2 will almost certainly follow suit.
The following is the commercial sales summary from our Q1 report:
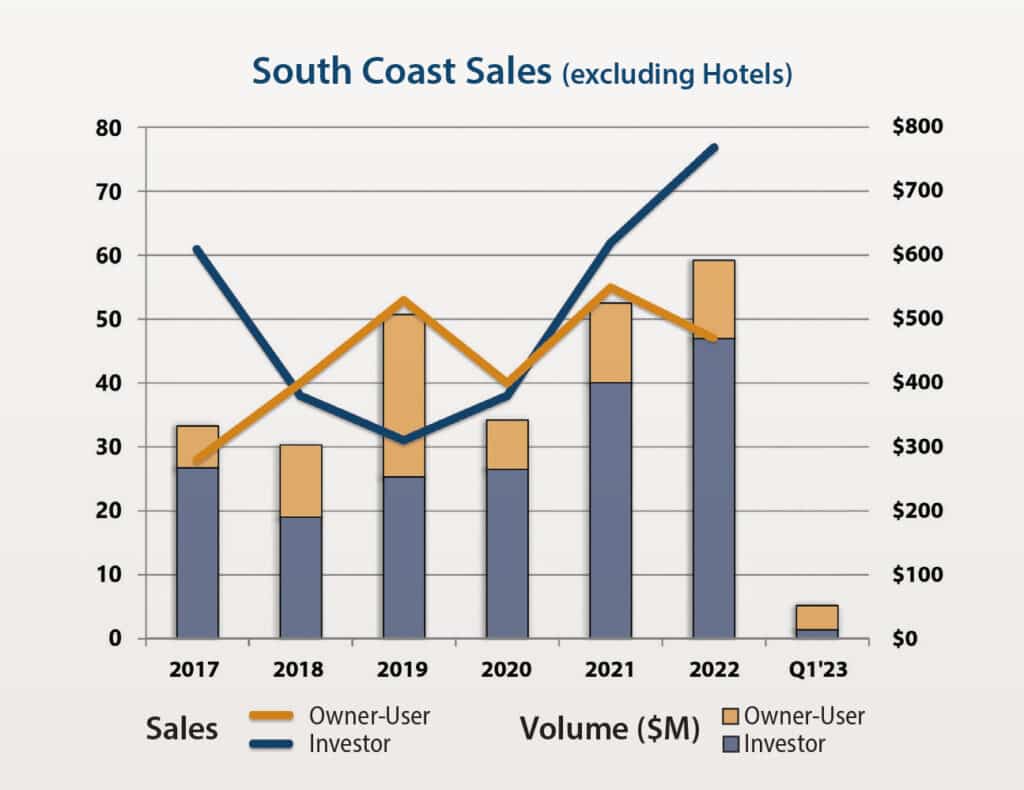
As expected, commercial sales volume decreased dramatically in Q1 compared to the record deal flow of 2022. Elevated interest rates—combined with recent turmoil in the banking sector—have created a challenging lending environment for commercial financing. Sellers have not adjusted pricing expectations accordingly, and as a result deals have not been coming together as they did a year ago. Investors in particular have been sidelined by these market conditions, and barring substantial interest rate cuts by the Fed, we anticipate relatively low sales velocity through the balance of 2023. On the bright side, owner-user sales have remained surprisingly resilient to date this year.
- There were 20 transactions in Q1, 17% below the 5-year average for first quarter sales. However, dollar volume (excluding hotels) was 54% below the 5-year trend because there were just a few high-priced sales. The market rebounded in April, though, posting 10 sales valued at $40.8 million for the month.
- At year-end 2022, the inventory for sale was at a historical peak of 76 offerings. Since then, the number of properties for sale has decreased 24%. The number of office properties for sale has decreased by one third.
- Investors have largely pulled in the reins due to higher interest rates. Asking prices have decreased somewhat, but not proportional to the rise in interest rates. Investor dollar volume was down more than 70% compared to the Q1 5-year average.
- With investors in a diminished role, 60% of the transactions were closed by owner-users. In fact, owner-user sales in Q1 were above the 5-year average for both transactions and dollar volume. For example, the 6,000 SF retail building at 6900 Hollister Ave in Goleta was purchased by an owner-user that will use a portion of the building and lease the rest. Similarly, in Santa Barbara the owner of Seven Bar & Kitchen purchased the former Neighborhood Bar building at 235 W Montecito St as a new home for the restaurant, while keeping the Rodeo Room as a tenant at the property.
- Investor demand for office property has been sapped by higher vacancy, the resulting underwriting barriers, and high interest rates. However, thanks to owner-user buyers there have been more office sales to date in 2023 than there were at this point in 2022. The important caveat is that the sales this year have been all been under $5 million, which is the typical price range for owner-users.
- Two notable land sales were transacted in April. RAF Pacifica purchased an undeveloped 7.6-acre site in Cabrillo Business Park with approved plans in hand for a 93,000 SF industrial or flex building. Two adjacent parcels in downtown Santa Barbara were purchased by Ed St. George, reportedly with the intent to eventually redevelop most of the 1-acre site with residential units.
- The two highest price sales in Q1 were a senior assisted living facility and a hotel. The 70-room memory care facility at 5464 Carpinteria Ave, converted from an office building about seven years ago, was just purchased by an owner-operator for $268 PSF. The Castillo Inn at 22 Castillo St in Santa Barbara’s West Beach neighborhood
sold for $992 PSF. West Beach has attracted increasing attention from investors and developers in recent years, coinciding with the swell in demand for hospitality and apartment properties, which are both prevalent in this well-situated area of town.